
The latest data showed signs of strength in the housing market while the labor sector is getting weaker. Plus, an important recession signal continues to reflect a slowing economy. Don’t miss these stories:
- What the Media Gets Wrong About Home Prices
- Home Builders Need to be “Starting” Something
- NAHB Reports Cautious Optimism Among Home Builders
- Job Market Getting Weaker
- Recession Signal Flashing
What the Media Gets Wrong About Home Prices
-png-2.png?width=371&height=325&name=existing-home-sales%20(1)-png-2.png)
Existing Home Sales fell 2.4% from February to March to a 4.44 million unit annualized pace, per the National Association of Realtors (NAR), which was in line with estimates. Sales were 22% lower than they were in March of last year. This report measures closings on existing homes, which represent around 90% of the market, making it a critical gauge for taking the pulse of the housing sector.
What’s the bottom line? While it’s true that buyer activity slowed in March, February was an especially strong month for closings, so a slight pullback last month was understandable.
In addition, multiple data points suggest that demand remains strong. Homes stayed on the market on average for 29 days, down sharply from 34 days in February. Plus, 65% of homes sold in March were on the market for less than a month, which is up from 57% and shows homes are selling quickly when they’re priced correctly. Meanwhile, investors accounted for 17% of transactions last month, making up roughly one out of every six deals. Clearly investors are seeing the opportunity in housing right now.
Also of note, there was a 0.9% decline in the median home price to $375,700 from a year earlier. However, this is not the same as a decline in home prices as some media reports implied.
The median home price simply means half the homes sold were above that price and half were below it, and this figure can be skewed by the mix of sales among lower-priced and higher-priced homes. In fact, we could see home prices increase across all price categories, but the median price could still fall if the concentration of sales was on the lower end. Actual appreciation numbers are higher, not lower, on a year-over-year basis according to key reports from Case-Shiller, CoreLogic and the Federal Housing Finance Agency.
Home Builders Need to be “Starting” Something
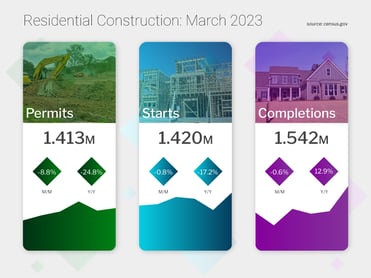
Construction of new homes slowed in March, with Housing Starts falling nearly 1% from February. Building Permits, which are indicative of future supply, also fell 8.8% for the month. While Starts and Permits for single-family homes both ticked higher from February to March, they were significantly lower than in March of last year.
What’s the bottom line? The housing sector is undersupplied, and not enough inventory is heading to the market. Starts for single-family homes have been on a downward trend over the last year, with the pace of 1.191 million units in March 2022 falling all the way to 861,000 units this March. Single-family permits have followed the same pattern, declining from a pace of 1.163 million units to 818,000 over the same period.
With single-family homes remaining in high demand among buyers, the imbalance between supply and demand should continue to be supportive of prices.
NAHB Reports Cautious Optimism Among Home Builders
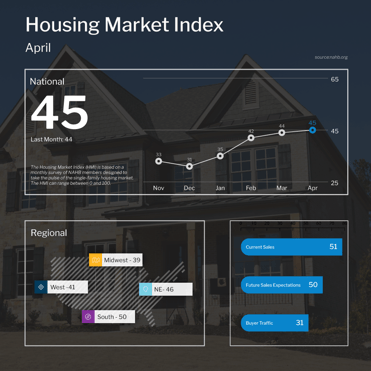
The National Association of Home Builders (NAHB) Housing Market Index, which is a near real-time read on builder confidence, rose one point to 45 in April, marking the fourth straight month this measure has increased. Among the components of the index, current sales conditions rose two points to 51 while sales expectations for the next six months increased three points to 50. Buyer traffic remained unchanged at 31.
What’s the bottom line? Home builder confidence has now risen 14 points since the low of 31 in December. Present sales conditions returned to expansion territory (over 50) for the first time since last September, while the future sales outlook is right at the breakeven between expansion and contraction at its highest level since June. Even though the overall confidence reading remains below 50 in contraction territory, sentiment continues to rebound in the right direction.
Job Market Getting Weaker
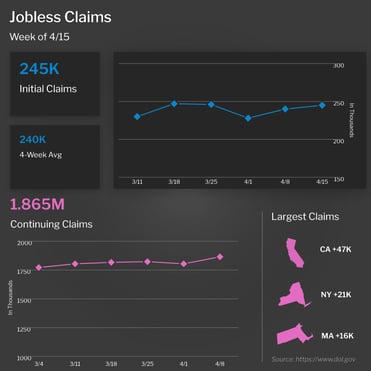
Initial Jobless Claims continued to move higher this month, with the number of people filing for unemployment benefits for the first time rising by 5,000 in the latest week to 245,000. This tied the third highest reading so far this year. Continuing Jobless Claims also surged to 1.865 million, up 61,000.
What’s the bottom line? Continuing Claims measure people who continue to receive benefits after their initial claim is filed and this data clearly shows that hiring has slowed. While the number can be volatile from week to week, the overall trend has been higher with an increase of around 576,000 since the low reached last September.
Plus, there’s greater evidence of workforce reductions as the four-week average of Initial Jobless Claims, which smooths out some of the weekly fluctuation among first-time filers, has hovered around 240,000 at a yearly high in recent weeks.
Recession Signal Flashing
The Conference Board released their Leading Economic Index (LEI) for March, which was down 1.2%, falling to “its lowest level since November of 2020, consistent with worsening economic conditions ahead,” said Justyna Zabinska-La Monica, Senior Manager, Business Cycle Indicators. This report is a composite of economic indexes and can signal peaks and troughs in the business cycle.
What’s the bottom line? The Conference Board explained that a warning signal occurs when the LEI 6-month growth rate on an annualized basis breaks beneath 0%. But a break beneath -4.2%, like we saw last month, is a recession signal that has been highly accurate historically. The Conference Board also stated that they believe the U.S. will enter a recession “starting in mid-2023.”