
By Barry Habib, CEO & Founder, Highway
Wayne Gretzky became the greatest hockey player of all time, because rather than skating to where the puck is, he skated to where the puck is going. The Fed, on the other hand, does not skate to where the puck is going, they don’t even skate to where the puck is, they skate to where the puck was. This is evident in their constant chant of being “data dependent.”
Inflation isn’t easy to measure, but it doesn’t have to be that hard either. We have seen inflation, as measured by headline CPI, drop dramatically from 9% to its current level of 4%. But coming on July 12, with the release of the June CPI data, we expect inflation to decline significantly to 3% on a year-over-year basis. With a little luck, we may even see a 2-handle. This is reflective of lower monthly inflation readings, but mostly due to the way year-over-year CPI works. As new data is released, it replaces the corresponding month’s data from the previous year. The new June data for 2023 will replace a very elevated 1.2% reading for the month of June 2022 alone.
The Fed pays close attention to the core rate of inflation, which removes food and energy prices. This reading is heavily weighted by shelter costs, which make up 43.2% of core CPI. Shelter also has a significance in overall headline CPI of 34%.
Let’s start with an understanding of what shelter costs are. Most would imagine it’s the price of a home or cost of a mortgage payment, but it’s neither of those. Shelter costs are comprised of rent – but not real-time rent. It’s the average over the past 12 months, which creates a significant lag. Adding to the lag could be someone who was surveyed within the recent 12 months but signed their lease months prior to that.
An even larger percentage of shelter costs is something called owners’ equivalent rent – this is where owners of homes are asked how much they think they can rent their home for. This appears to be very unreliable. For example, do you know how much you’d rent your own home for?
The final piece of shelter costs has a small weighting, but it can be influential because it’s quite volatile month-to-month. This is called lodging away from home, which includes things like hotels and Airbnbs.
As you can anticipate, shelter data is highly influential due to its weighting but also has a very significant lag to what’s happening in real-time. The Fed’s dependence on this data is like driving down the highway while being focused on the rear-view mirror. It has caused boom/bust cycles, as the Fed is unaware of inflection points in the economy. They keep rates too low for too long and push rates too high for too long. A perfect example of this can be seen in the chart below displaying real-time year-over-year rents versus the way it’s expressed in CPI.
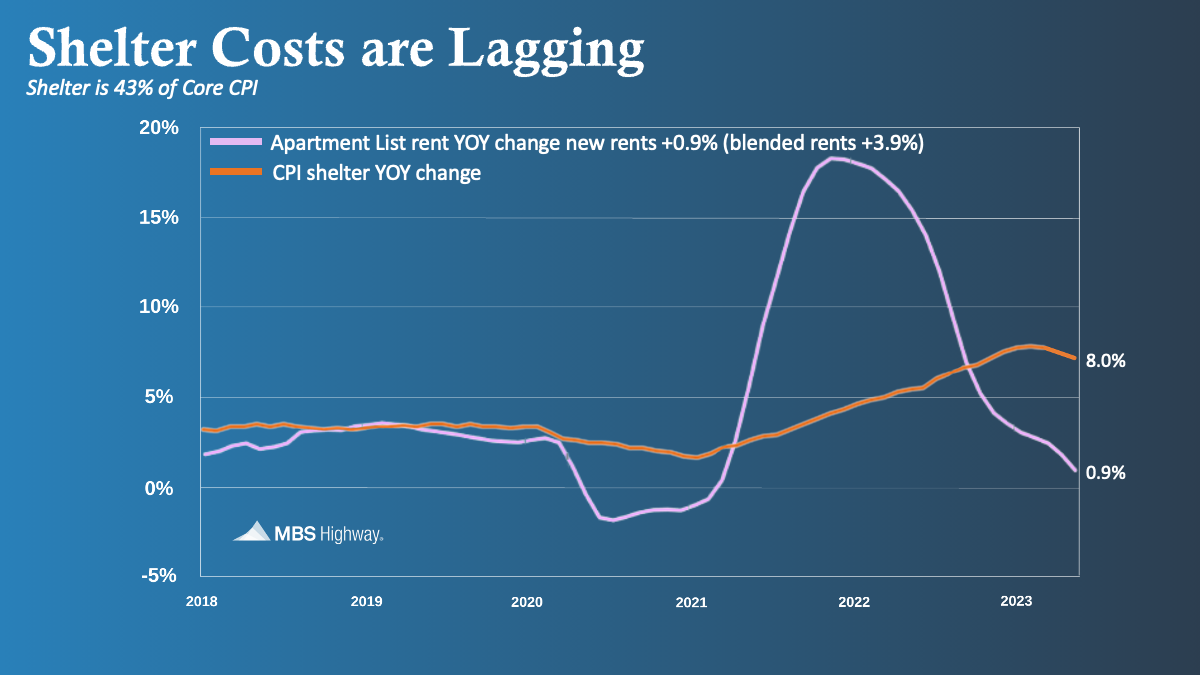
Notice how real-time new rents are currently rising less than 1% year-over-year and have been on a steady decline. It should be noted that renewal rents are higher, but the downward trajectory is evident. The blended rate of these two indicates an annual rise in rents just under 4%. However, due to the lags, it is carrying a weight of an 8% rise in CPI. We can easily calculate the false impact of this on the reading. Let’s take the core CPI today of 5.3%, which the Fed feels is both too high and not dropping fast enough. The lag between the 8% year-over-year shelter measurement in CPI versus the 4% real-time reading leaves a 4% difference. At a 0.432 weighting, the artificial increase to core CPI is about 1.7%. This would bring actual core CPI to 3.6%, which is a lot closer to the Fed’s 2% target, especially since the trajectory would be sharply lower. This is where the puck is going.
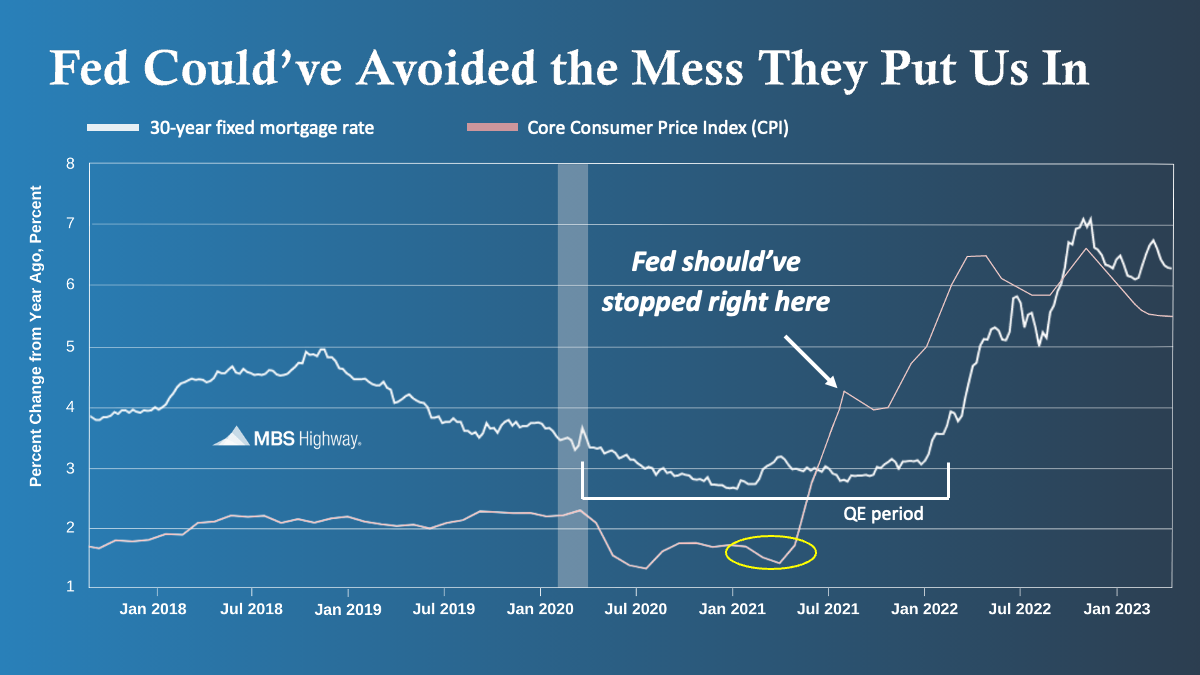
This also explains how we got into this inflation mess in the first place – the Fed does not just miss inflation to the downside, but also to the upside. Back in spring of 2021, virtually all the Fed members, as well as Janet Yellen who was screaming to “go BIG” on quantitative easing (QE), were begging for more inflation, continued buying a massive number of mortgage-backed securities and Treasuries, and kept the Fed Funds Rate at zero because they were, once again, looking at lagging inflation indicators. Back then, the shelter component within CPI only showed 1.5% year-over-year growth, but in real-time, rents were rising 15%.
Had the Fed considered this lag, they could’ve stopped QE a year sooner and hiked more modestly to avoid the banking crisis and the pain families and businesses are feeling today.
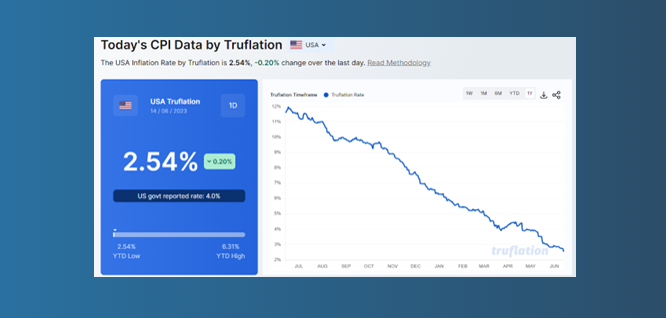
Inflation is coming down, but it depends on how it’s measured. CPI considers 80,000 data points, much of them lagging, but inflation, as measured by the folks at Truflation, considers 10M data points in real-time, showing inflation around 2.5%.
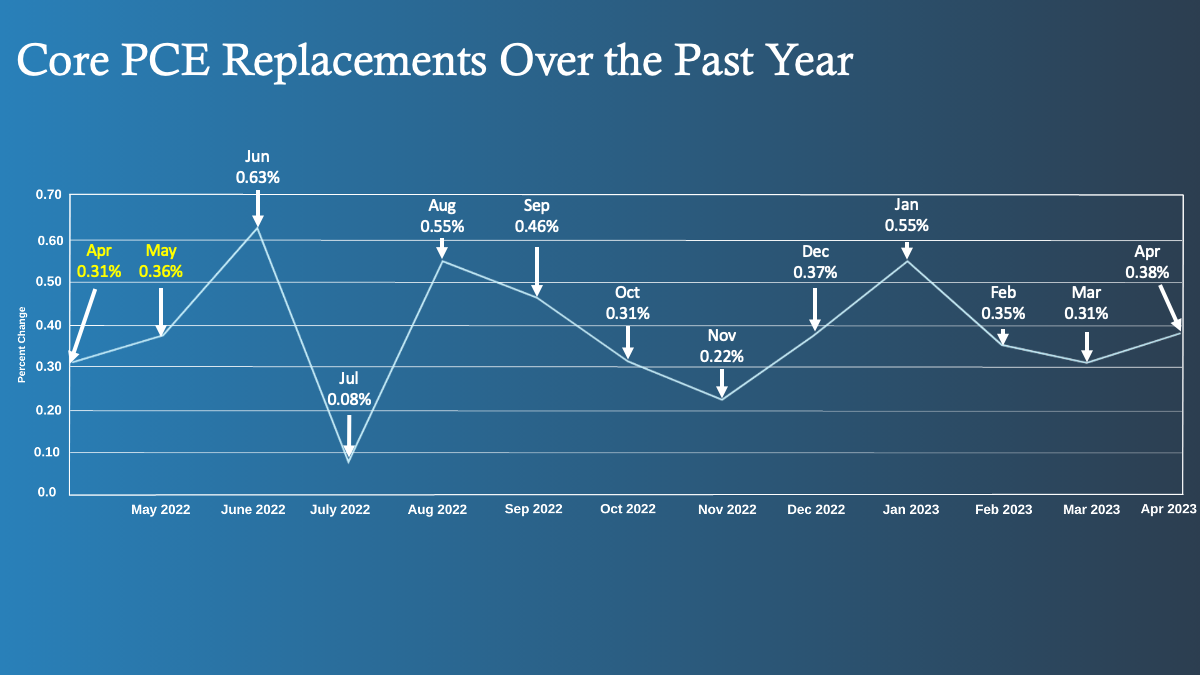
At the latest Fed meeting, it was very clear that Jerome Powell and the Fed now want to see an inflation reading of 2% on core Personal Consumption Expenditures (PCE), which has a lower weighting on shelter costs and is a bit different than CPI. The current core PCE reading is 4.7% year-over-year … so there’s a long way to go to reach 2%. As mentioned earlier, when each new month’s data is released, it replaces data from the same month in the previous year. According to our math, core PCE will make progress towards about 3.7% by the end of 2023, but nowhere near the 2% the Fed wants. You can see the previous 12 months’ values in the chart below. Remember, to get to 2% year-over-year, you’d need an average reading of 0.166% per month; that’s very hard to do.
So, for this to happen, realistically, the Fed must break something: a significantly negative change in the labor market, another crisis, or a recession.
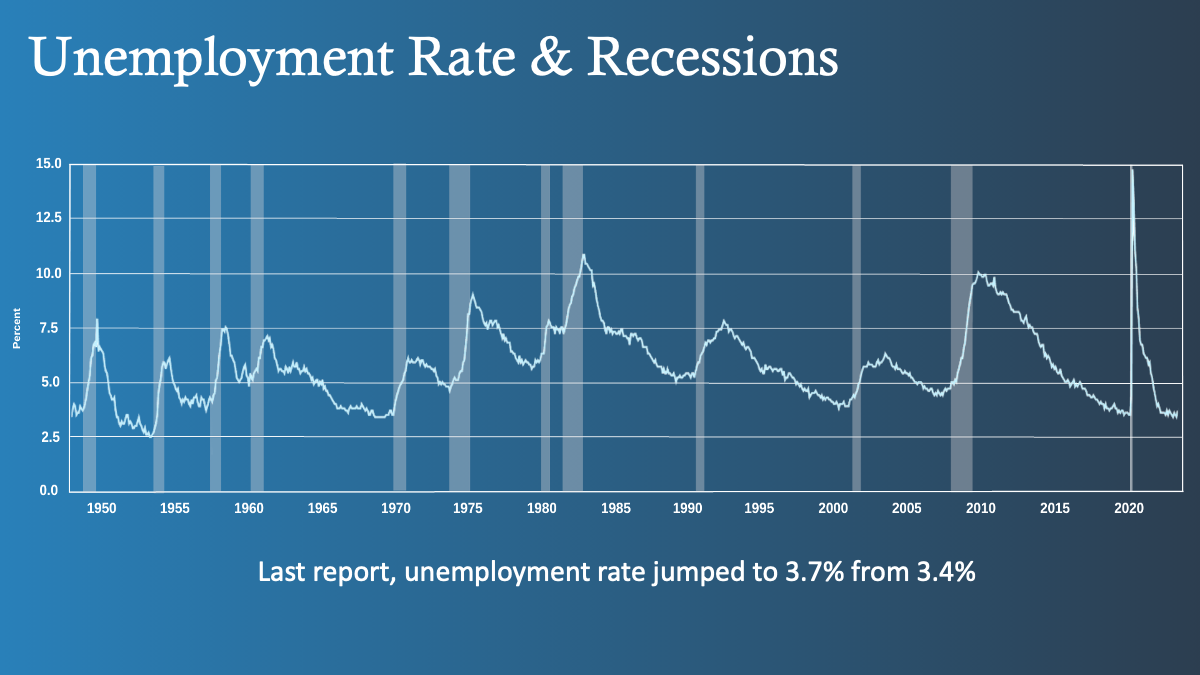
Remember, don’t be fooled by the low unemployment rate giving you security about preventing a recession. As you can see by the chart below, recessions happen once the unemployment rate reaches its lowest point in the cycle and begins to tick higher by about 0.5%. We’ve already seen an increase to 3.7% from the low of 3.4%, so that’s 0.3% already.
Unless the Fed changes its approach, one of the aforementioned outcomes appear to be where the puck is going.
Introducing Highway.ai
Three great brands (MBS Highway + ListReports + CMA) have come together to form Highway.ai — the leading software and market insights solution for residential mortgage and real estate professionals.
For more information, or to sign up for a free trial, visit our new website: https://www.highway.ai/