
Sales of new homes and consumer inflation were both hotter than expected in January. Plus find out what the latest data on Existing Home Sales says about inventory and the demand for homes.
- Consumer Inflation Higher Than Expected
- More to Existing Home Sales Data Than Meets the Eye
- New Home Sales Jumped Higher in January
- What Jobless Claims Data Suggests for Workers and Job Seekers
- Recession Signal Flashing
Consumer Inflation Higher Than Expected
The Fed’s favorite measure of inflation, Personal Consumption Expenditures (PCE), showed that headline inflation increased 0.6% in January, while the year-over-year reading rose from an upwardly revised 5.3% to 5.4%. Core PCE, which strips out volatile food and energy prices, rose by 0.6% with the year-over-year change increasing from an upwardly revised 4.6% to 4.7%.
What’s the bottom line? Inflation is the arch enemy of fixed investments like Mortgage Bonds because it erodes the buying power of a Bond's fixed rate of return. If inflation is rising, investors demand a rate of return to combat the faster pace of erosion due to inflation, causing interest rates to rise. While inflation had been trending lower, this report was a disappointment as both year-over-year readings were above estimates and moved higher in the wrong direction. Hopefully, February’s report will be friendlier when it is released in March.
More to Existing Home Sales Data Than Meets the Eye
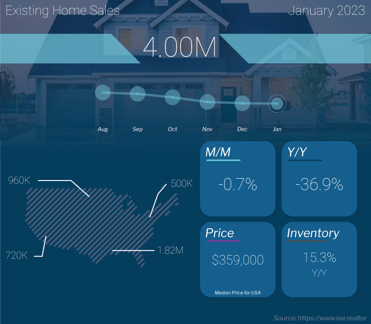
Existing Home Sales fell 0.7% from December to January to a 4 million unit annualized pace, per the National Association of Realtors (NAR), coming in a bit below expectations and marking the twelfth consecutive month of declines. Sales were also 36.9% lower than they were in January of last year. This is a critical report for taking the pulse of the housing market, as it measures closings on existing homes, which represent around 90% of the market.
What’s the bottom line? While it’s true that buyer activity was slower, multiple data points suggest that demand remains strong. Homes stayed on the market on average for 33 days, up from 26 days in December, but they are still moving fast. Plus, 54% of homes sold in January were on the market for less than 30 days.
In addition, unsold inventory increased slightly from December to 980,000 homes available at the end of January, but it remains below normal with just a 2.9 months’ supply available at the current sales pace.
However, inventory is even tighter than that figure implies. Of the 980,000 homes counted as unsold inventory, only 626,000 were “active listings” while 354,000 homes (or 36% of the total) were under contract and not truly available for purchase. This data also speaks to ongoing demand for homes, as a normal market has 25% of inventory under contract.
New Home Sales Jumped Higher in January
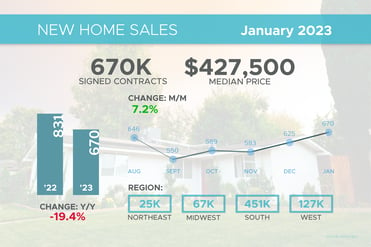
New Home Sales, which measure signed contracts on new homes, rose 7.2% in January to a 670,000-unit annualized pace. This was much stronger than estimates and marks the second straight month that sales moved higher. However, sales were 19.4% lower than they were in January of last year. Alicia Huey, chair for the National Association of Home Builders, noted the latest Housing Market Index showed that “57% of builders are using incentives to bolster sales.”
What’s the bottom line? Inventory is tight in the new home market as well. There were 439,000 new homes for sale at the end of January, which equates to a 7.9 months’ supply at the current sales rate. However, only 68,000 were completed, with the rest either not started or under construction. The number of completed homes equates to a 1.2 months’ supply, well below a balanced market.
In addition, while the median sales price fell from $465,600 in December to $427,500 in January, this is not the same as a decline in home prices. The median price simply means half the homes sold were above that price and half were below it, and this figure can be skewed by the mix of sales among lower-priced and higher-priced homes.
What Jobless Claims Data Suggests for Workers and Job Seekers
-png-Feb-24-2023-02-36-53-8515-PM.png?width=371&height=371&name=jobless-claims%20(3)-png-Feb-24-2023-02-36-53-8515-PM.png)
The number of people filing for unemployment benefits for the first time declined by 3,000 in the latest week, as 192,000 Initial Jobless Claims were reported. Continuing Claims, which measure people who continue to receive benefits after their initial claim is filed, fell 37,000 to 1.654 million.
What’s the bottom line? Initial Jobless Claims remain muted, reflecting a tight labor market where companies are doing their best to hold on to workers. And while Continuing Claims can be volatile from week to week, the overall trend has been higher, as they have now risen by more than 300,000 since the low reached last September.
This data suggests it’s harder for people who are let go to find new employment, which aligns with recent comments from ZipRecruiter noting that, "With an increasingly uncertain macroeconomic backdrop, employers have moderated their hiring plans and reduced their recruitment budgets in the first weeks of the year. Online job postings in our marketplace remained in line with the low point of the 2022 holiday season, rather than following the longstanding seasonal pattern of beginning a run-up in January.”
Recession Signal Flashing
The Conference Board released their Leading Economic Index (LEI) for January showing that it fell 0.3%, following a 0.8% decline in December. This report is a composite of economic indexes and can signal peaks and troughs in the business cycle.
What’s the bottom line? The LEI 6-month growth rate on an annualized basis was -7.4%. The Conference Board explained that when this number breaks beneath 0%, it is a warning signal, while a break beneath -4% is a recession signal that has been highly accurate historically. The Conference Board also stated that they believe the U.S. will enter a recession this year.