Consumer inflation has been widespread this year, with prices rising on food, gas and a variety of goods and services throughout the economy.
High inflation is significant for many reasons. Besides causing higher prices, inflation is also the arch enemy of fixed investments like Mortgage Bonds because it erodes the buying power of a Bond's fixed rate of return. If inflation is rising, investors demand a rate of return to combat the faster pace of erosion due to inflation, causing interest rates to rise as we’ve seen this year.
The Fed has been under pressure since late last year to address soaring inflation, and in response they have hiked their benchmark Fed Funds Rate five times so far this year, including their latest aggressive 75 basis point hike at their meeting on September 21. Remember the Fed Funds Rate is the interest rate for overnight borrowing for banks and it is not the same as mortgage rates. When the Fed hikes the Fed Funds Rate, they are trying to slow the economy and curb inflation.
This begs the questions:
How much longer will elevated inflation last?
And how long until we see mortgage rates start to decline, to give homebuyers some relief?
The below chart which features recent monthly readings for the Core Consumer Price Index (CPI) helps us analyze when we may start to see some meaningful declines in inflation. Note that Core CPI strips out volatile food and energy prices which are included in the headline reading.
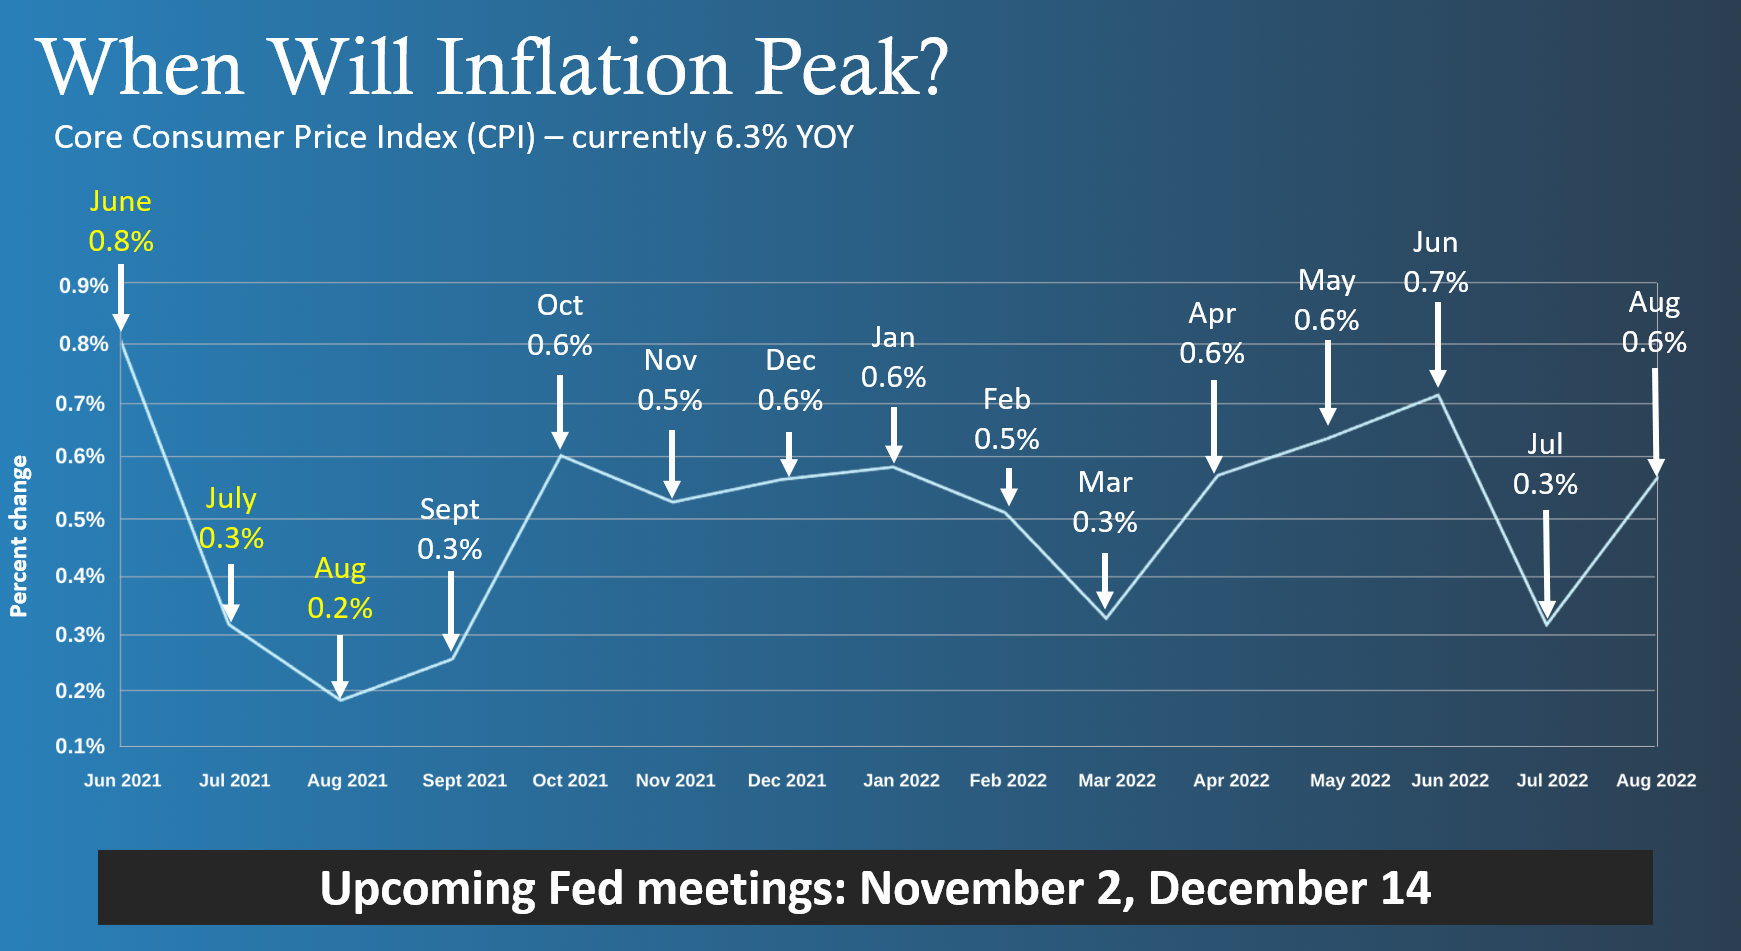
First, it’s important to understand that inflation is calculated on a rolling 12-month basis, which means that the total of the past 12 monthly inflation readings will give us the year over year rate of inflation. For example, when the data for August 2022 of 0.6% was released on September 13, it replaced 0.2% from August 2021, causing annual Core CPI to rise from 5.9% in July to 6.3% in August.
Looking at upcoming months, inflation readings after September of last year are higher comparisons, ranging from 0.5% to 0.6% from October 2021 through February 2022. We know that the Fed is expected to hike an additional 125 basis points this year, which may be 75 basis points at their November 2 meeting and 50 basis points at their December 14 meeting. Again, these hikes are designed to slow the economy and curb inflation.
So, if we start to see more realistic recession-like numbers for inflation this fall, such as 0.1% or 0.2% a month from October onwards, these would replace the higher comparisons of 0.5% and 0.6% as seen in the chart. As a result, we could see the year-over-year rate of inflation decline by 2% by the time January’s reading is released in February of next year. This would bring Core CPI down from 6.3% to just over 4% year over year.
If we look ahead even further, note the higher comparisons seen in the chart for April (0.6%), May (0.6%) and June (0.7%) of 2022. By the time the reading for June 2023 is reported in July, the year-over-year rate of inflation could decline by another 1.5% to 2% as these high numbers from 2022 are replaced, depending on how high or low inflation is each month next year.
The bottom line is we could see the year over year Core CPI under 3% by the end of the second quarter of 2023. Since mortgage rates are primarily driven by inflation, lower inflation could bring an improvement in Mortgage Bonds and mortgage rates next year.
Do you want analysis like this on a daily basis?
MBS Highway can help!
Investing in an MBS Highway membership – where you'll have access to our daily morning update video featuring analysis on the markets and economic data as well as tools like our Bid Over Asking Price, Buy vs. Rent Comparison, Loan Comparison, lock alerts and more – means you'll have everything you need to turn prospective homebuyers into clients and become the type of advisor they need to guide them in today's market and for years to come.
Take a free 14-day trial of MBS Highway and see for yourself how we can help you grow your business this year.