
Tight inventory continued to impact sales of existing homes last month, while home builders responded with an uptick in construction to help meet buyer demand. Don’t miss these details:
- Existing Home Sales Edge Higher Even with Tight Inventory
- Home Builder Confidence Continues to Rise
- Home Construction Surged in May
- New Trend Reached in Jobless Claims?
- Recession Signals Flashing
Existing Home Sales Edge Higher Even with Tight Inventory
-png-3.png?width=371&height=325&name=existing-home-sales%20(1)-png-3.png)
Existing Home Sales rose 0.2% from April to May to a 4.30-million-unit annualized pace, per the National Association of REALTORS® (NAR). However, sales were 20.4% lower than they were in May of last year. This report measures closings on existing homes, which represent around 90% of the market, making it a critical gauge for taking the pulse of the housing sector.
What’s the bottom line? Tight supply played a key role in the pace of sales, per NAR’s Chief Economist Lawrence Yun, who noted that, “Newly constructed homes are selling at a pace reminiscent of pre-pandemic times because of abundant inventory in that sector. However, existing-home sales activity is down sizably due to the current supply being roughly half the level of 2019.”
In fact, total existing housing inventory at the end of May equaled 1.08 million homes, well below normal with just 3 months’ supply available at the current sales pace.
Despite ongoing tight supply, demand among buyers remains strong as evidenced by how quickly correctly priced homes are selling. Homes stayed on the market on average for 18 days last month, down from 22 days in April. Plus, 74% of homes sold in May were on the market for less than a month, which is up from 73% in April and 65% in March.
Also of note, the median existing home price fell 3.1% to $396,100 from a year earlier, though does not mean home prices are declining. The median home price simply means half the homes sold were above that price and half were below it, and this figure can be skewed by the mix of sales among lower-priced and higher-priced homes. Actual appreciation numbers are higher, not lower, on a year-over-year basis and are showing acceleration according to key reports from Case-Shiller, CoreLogic and the Federal Housing Finance Agency.
Home Builder Confidence Continues to Rise
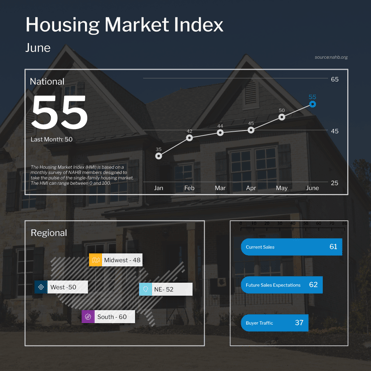
The National Association of Home Builders (NAHB) Housing Market Index, which is a near real-time read on builder confidence, rose five points to 55 in June. Any reading above 50 on this index, which runs from 0 to 100, signals expansion while readings below 50 signal contraction. June’s reading marks the sixth straight month this measure has increased and is the first time that sentiment has moved into positive territory since last July.
All three components of the index (which include current sales conditions, sales expectations for the next six months, and buyer traffic) posted gains, with both current and future sales above 60 for the first time in a year.
What’s the bottom line? The NAHB noted that the lack of existing home inventory, improving supply chains, and solid demand among buyers are key factors in the rising optimism among home builders. NAHB Chief Economist Robert Dietz added, “A bottom is forming for single-family home building as builder sentiment continues to gradually rise from the beginning of the year.”
Home Construction Surged in May
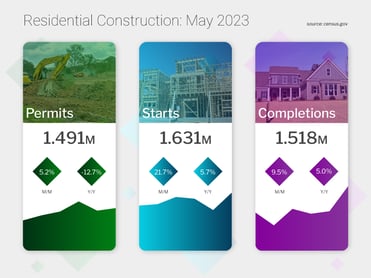
Construction of new homes continued to increase this spring, with Housing Starts rising 21.7% from April to May. This data measures when excavation actually begins for a home’s foundation or footing. Building Permits, which are more indicative of future supply, rose 5.2% for the month. Starts and Permits for single-family homes also increased in May, though at a smaller percentage than they did for multi-family units.
What’s the bottom line? NAHB Chair Alicia Huey said, “Mirroring rising builder sentiment, single-family permits and starts increased in May as builders boosted production to meet unmet demand.” Yet, while single-family starts and permits have risen since the beginning of the year, they are still significantly lower than they were a year ago.
Overall, the housing sector remains undersupplied and not enough inventory is heading to the market. With single-family homes remaining in high demand among buyers, the imbalance between supply and demand should continue to be supportive of prices.
New Trend Reached in Jobless Claims?
-png-Jun-22-2023-07-09-41-8678-PM.png?width=371&height=371&name=jobless-claims%20(6)-png-Jun-22-2023-07-09-41-8678-PM.png)
Unemployment Claims remain elevated among both first-time and continuing filers. There were 264,000 Initial Jobless Claims reported in the latest week, matching the number of people from the previous week after that data was revised slightly higher. Continuing Claims came in at 1.759 million, though this was a slight decline from 1.772 million the week beforehand.
What’s the bottom line? Initial Jobless Claims have remained above 200,000 each week since February, with claims staying over 260,000 for the last three weeks, suggesting that these latest figures are a trend rather than an outlier. Continuing Claims are also significantly above the low point of 1.289 million filers seen last September, though they have declined from highs reached earlier this spring, due in part to benefits expiring for some people. Overall, this data reflects the challenges many are facing as they search for new employment.
Recession Signals Flashing
The Conference Board released their Leading Economic Index (LEI), which is a composite of economic indexes that can signal peaks and troughs in the business cycle. May brought a 0.7% decline, marking the fourteenth consecutive month of contraction and pointing to “weaker economic activity ahead,” said Justyna Zabinska-La Monica, Senior Manager, Business Cycle Indicators. The last time this index fell for fourteen straight months was in 2007, before the great recession.
There are also signs of stalling economic conditions overseas, as the Global Purchasing Managers' Index (PMI) showed that Japan is clearly in contraction while Australia, the Eurozone, and the United Kingdom all slowed and are just above contraction territory.
What’s the bottom line? The globe is interconnected, and economies of different countries rely on each other for trade. As a result, recessions tend to be globally synchronized because loss of demand in one country tends to pull activity in other areas down. While there is usually an average of 50% of global economies in a recession at the same time, certain circumstances like the COVID pandemic can lead to a larger level of synchronicity. This ongoing situation remains important to monitor in the months ahead.