
While job growth in May looked strong on the surface, a deeper look at the data shows underlying weakness in the labor sector. Plus, the latest home price appreciation data shows the opportunities that exist for buyers. Here are the details:
- Conflicting Job Numbers
- Leisure and Hospitality Jobs Boost Private Sector Employment
- Unemployment Claims Remain Elevated
- Home Prices Continue to Rebound
Conflicting Job Numbers
-png-3.png?width=371&height=278&name=bls-jobs-report%20(1)-png-3.png)
The Bureau of Labor Statistics (BLS) reported that there were 339,000 jobs created in May, which was much larger than estimates. Job growth in March and April was also revised higher, adding 93,000 additional jobs in those months combined. The unemployment rate rose from 3.4% to 3.7%.
What’s the bottom line? There are two reports within the Jobs Report and there is a fundamental difference between them. The Business Survey is where the headline job number comes from, and it's based predominately on modeling and estimations. The Household Survey, where the Unemployment Rate comes from, is derived by calling households to see if they are employed, so it’s a bit more real-time.
The Household Survey has its own job creation component, and it showed that there were 310,000 job losses, which is a stark contrast to the headline job growth number.
In addition, one of the biggest reasons we saw job gains in the Business Survey was the birth/death model, where the BLS estimates hiring from new business creation relative to closed businesses. The problem with this modeling is it overestimates during the inflection point of a downturn (like we’re in right now) and underestimates at the inflection of an upturn after a recession.
In May, this modeling added 231,000 jobs but it’s hard to believe that many businesses were created last month in the current economic climate where there is less lending from banks.
Leisure and Hospitality Jobs Boost Private Sector Employment
-png-1.png?width=371&height=278&name=adp-employment%20(1)-png-1.png)
Private payrolls were much stronger than expected last month, as the ADP Employment Report showed that there were 278,000 jobs created in May. Annual pay for job stayers increased 6.5% and job changers saw an average increase of 12.1%. While these figures are still high, they reflect a year-long slowdown and lower wage-pressured inflation.
What’s the bottom line? ADP noted that “gains in private employment were fragmented last month.” Leisure and hospitality once again led the way with 208,000 job gains, which was more than double the growth reported in any other industry sector. However, these job gains may not continue to bolster the overall private payroll total for much longer.
In April 2019, there were 16.2 million leisure and hospitality employees and there are now 16.5 million after last month’s gains, meaning we have eclipsed where we were pre-Covid.
Unemployment Claims Remain Elevated
-png-Jun-02-2023-07-27-12-8070-PM.png?width=371&height=371&name=jobless-claims%20(2)-png-Jun-02-2023-07-27-12-8070-PM.png)
Initial Jobless Claims rose 2,000 in the latest week, with 232,000 people filing for unemployment benefits for the first time. Again, this reflects 232,000 new filers and we have seen Initial Jobless Claims top 200,000 every week since the start of February.
Meanwhile, the number of people still receiving benefits after their initial claim is filed remains elevated with 1.795 million Continuing Claims reported. This is well above the low of 1.289 million seen last September and this upward trend shows the difficulties many people are having as they search for new employment.
Home Prices Continue to Rebound
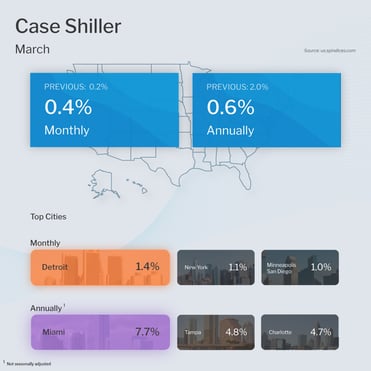
The Case-Shiller Home Price Index, which is considered the “gold standard” for appreciation, showed home prices nationwide rose 0.4% from February to March after seasonal adjustment. Home prices were also 0.7% higher when compared to March 2022, though this annual reading is a decline from the 2.1% gain reported in February.
The Federal Housing Finance Agency (FHFA) also released their House Price Index, which revealed that home prices rose 0.6% from February to March. This follows the 0.1% monthly gain reported in January and the 0.7% gain in February. Prices rose 3.6% from March 2022 to March 2023, though this was a slight decline from the 4.2% annual increase reported in February.
These figures differ in part because FHFA’s report measures home price appreciation on single-family homes with conforming loan amounts, which means it most likely represents lower-priced homes. FHFA also does not include cash buyers or jumbo loans.
What’s the bottom line? The uptick in appreciation over the last few months suggests we’re past the inflection point and home prices are on the rise again. “The modest increases in home prices we saw a month ago accelerated in March 2023,” explained S&P DJI Managing Director Craig J. Lazzara, who added that prices are now only 3.6% below their peak from June 2022. This is a far cry from the housing crash of 20% that some in the media have forecasted and shows the opportunity that remains for homebuyers to start building wealth through real estate.