
Inflation continues to trend lower while home prices continue to be supported by the ongoing dynamic of high demand and tight supply. Here are the takeaways:
- Inflation Improving One Step at a Time
- Lack of Existing Home Inventory a “Major Constraint”
- March New Home Sales Reach Yearly High
- Appreciation Data Turning Around
- Jobless Claims Trend Higher Despite Weekly Drop
- First Quarter GDP Well Below Estimates
Inflation Improving One Step at a Time
The Fed’s favorite measure of inflation, Personal Consumption Expenditures (PCE), showed that headline inflation increased 0.1% in March, while the year-over-year reading made a nice improvement from 5.1% to 4.2%. Core PCE, which strips out volatile food and energy prices, also rose by 0.3% with the year-over-year change declining from 4.7% to 4.6%.
What’s the bottom line? Inflation is the arch enemy of fixed investments like Mortgage Bonds because it erodes the buying power of a Bond's fixed rate of return. If inflation is rising, investors demand a rate of return to combat the faster pace of erosion due to inflation, causing interest rates to rise like we saw throughout much of last year.
Inflation continues to trend lower in the right direction, though last month’s reading would have been even lower if the decelerating shelter costs seen in the real world were better reflected in the PCE report. Once this lagging shelter data catches up in the PCE report, it should cause additional downside pressure to inflation.
Lack of Existing Home Inventory a “Major Constraint”
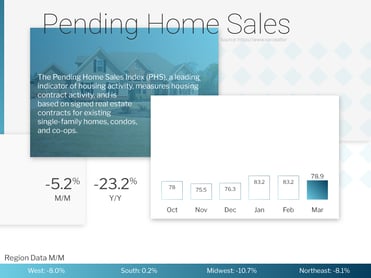
Pending Home Sales fell 5.2% from February to March, which was much weaker than expectations and marks the first monthly decline since November. Sales were also down 23.2% from a year earlier. Pending Home Sales is a critical report for taking the pulse of the housing market. The data is considered a forward-looking indicator of home sales because it measures signed contracts on existing homes, which represent around 90% of the market.
What’s the bottom line? Recent data showed that there were nearly 200,000 fewer active listings at the end of March than there were in November. Lawrence Yun, chief economist for the National Association of REALTORS®, confirmed, “The lack of housing inventory is a major constraint to rising sales. Multiple offers are still occurring on about a third of all listings, and 28% of homes are selling above list price. Limited housing supply is simply not meeting demand nationally."
March New Home Sales Reach Yearly High
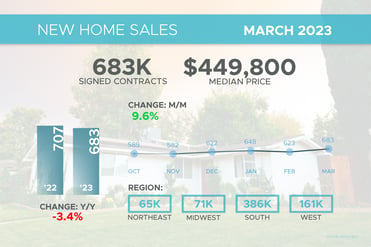
New Home Sales, which measure signed contracts on new homes, surged 9.6% in March to a 683,000-unit annualized pace. This was much stronger than estimates of a 1% increase and the best number in the past twelve months. In addition, sales were just 3.4% lower than they were in March of last year.
The median sales price rose from $433,200 in February to $449,800 in March. Note that this figure is not the same as appreciation but represents the mid-price and can be skewed by the mix of sales among lower-priced and higher-priced homes.
What’s the bottom line? There were 432,000 new homes for sale at the end of March, which equates to a 7.6 months’ supply at the current sales rate. While this may sound like a large amount, a closer look shows that only 71,000 were actually completed, with the rest either not started or under construction. When comparing the pace of sales versus homes that were actually completed, there was only 1.2 months’ worth of available supply, which is well below a balanced market.
This disparity between the high demand for homes and tight supply of both existing and new homes will continue to be supportive of home prices.
Appreciation Data Turning Around
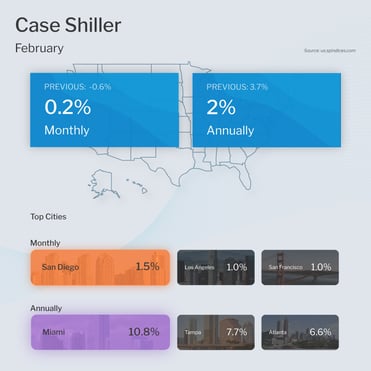
The Case-Shiller Home Price Index, which is considered the “gold standard” for appreciation, showed home prices rose 0.2% from January to February and they were 2% higher when compared to February 2022. This annual reading is a decline from the 3.7% gain reported in January.
The Federal Housing Finance Agency (FHFA) also released their House Price Index, which revealed that home prices rose 0.5% from January to February. This follows the 0.2% monthly gain reported in January. While prices rose 4% from February 2022 to February 2023, this was a decline from the 5.3% annual increase reported in January.
These figures differ in part because FHFA’s report measures home price appreciation on single-family homes with conforming loan amounts, which means it most likely represents lower-priced homes. FHFA also does not include cash buyers or jumbo loans.
What’s the bottom line? S&P DJI Managing Director Craig J. Lazzara noted that, “The National Composite, which had declined for seven consecutive months, rose a modest 0.2% in February, and now stands 4.9% below its June 2022 peak.” This is a far cry from a housing crash of 20% that some in the media have been predicting.
In addition, February’s monthly increase signals an inflection point, as does the turnaround in some of the hardest hit cities which saw price gains after several months of declines, including among others San Diego (+1.5%), San Francisco (+1%) and Detroit (+0.8%).
Jobless Claims Trend Higher Despite Weekly Drop

Initial Jobless Claims fell 16,000 in the latest week, as 230,000 people filed for unemployment benefits for the first time. The number of people continuing to receive unemployment benefits after their initial claim is filed also fell 3,000 to 1.858 million.
What’s the bottom line? While these numbers can be volatile from week to week, the overall trend has been higher. Initial Jobless Claims have remained above 200,000 since early February while Continuing Claims have now risen by 569,000 since the low reached last September. These numbers are further evidence of workforce reductions, and the challenges people are subsequently facing as they search for new employment.
First Quarter GDP Well Below Estimates
The first reading of first quarter 2023 Gross Domestic Product (GDP) showed that the U.S. economy grew by 1.1%, which was much lower than estimates of 2% to 2.5%. Note that this is the first of three readings and there can be significant revisions when the second and final readings are released on May 25 and June 29, respectively. However, given that GDP functions as a scorecard for the country’s economic health, the disappointing reading is a further sign that the economy slowed faster than expected in the first three months of this year.