
Home sales and home construction slowed in September while recession signals are flashing from the manufacturing sector. Don’t miss these stories:
- What Housing Supply and Demand Dynamics Mean for Prices
- Construction of Single-Family Homes Continues to Decline
- Builder Confidence Falls for Tenth Straight Month
- Jobless Claims Remain Volatile
- More Economic Slowdown Signals
What Housing Supply and Demand Dynamics Mean for Prices
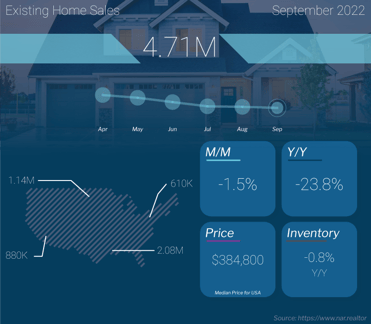
Existing Home Sales fell 1.5% from August to September to a 4.71 million unit annualized pace, per the National Association of Realtors (NAR). Sales were also down 23.8% when compared to September of last year. This is a critical report for taking the pulse of the housing market, as it measures closings on existing homes, which represent around 90% of the market.
What’s the bottom line? Activity in the housing market has certainly slowed, but home prices are still being supported by continued low inventory. Plus, the rise in inventory that occurs every summer from parents listing their homes so their kids are settled for the new school year has crested.
The number of available homes declined for the second month in a row, from 1.28 million at the end of August to 1.25 million at the end of September. This equates to a 3.2 months’ supply of homes.
However, there were only 732,000 “active listings” in September, which means that 41% of the “inventory” in the Existing Home Sales report is under contract and not truly available. This speaks to demand, as a normal market has 25% of inventory under contract. When looking at the months’ supply of available homes for sale, it’s really 1.9 months.
And while there are reports that homes are sitting longer on the market, they are still selling quickly when priced correctly. Average days on market increased slightly from 16 days in August to 19 days in September, while 70% of homes were on the market for less than 30 days.
NAR’s chief economist, Lawrence Yun, explained how today’s dynamics are so different than during the housing bubble. “Despite weaker sales, multiple offers are still occurring with more than a quarter of homes selling above list price due to limited inventory." He added, "The current lack of supply underscores the vast contrast with the previous major market downturn from 2008 to 2010, when inventory levels were four times higher than they are today."
Construction of Single-Family Homes Continues to Decline
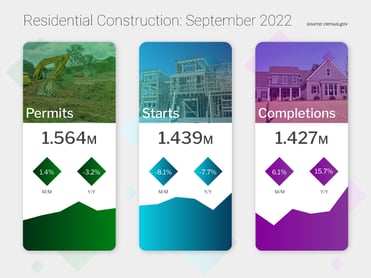
September also brought a slowdown in home construction as Housing Starts, which measure the start of construction on homes, fell 8.1% from August. Starts for single-family homes, which are the most important because they are in such high demand among buyers, were also down 4.7% from August and 18.5% from September of last year. Building Permits for single-family homes, which are indicative of future supply, also fell 3.1% for the month and 17.3% year over year.
Housing Completions were up 6.1% from August to a 1.427 million unit annualized pace. While this is a step in the right direction, household formations are trending between 1.6 million and 1.7 million annualized, meaning completions are not keeping pace.
What’s the bottom line? Builders have clearly slowed down production and it appears they have learned their lesson from 2006 and 2007, when they kept building homes despite waning demand. However, the lack of new supply coupled with the fact that many existing homeowners are staying put with a 3% mortgage should provide some support for home values.
These dynamics are also reflected in Zillow’s September Home Value Index, which showed that home values increased 14.9% year over year. Zillow also forecasted that homes will appreciate 2% in the year going forward, which is still meaningful for wealth creation.
Builder Confidence Falls for Tenth Straight Month
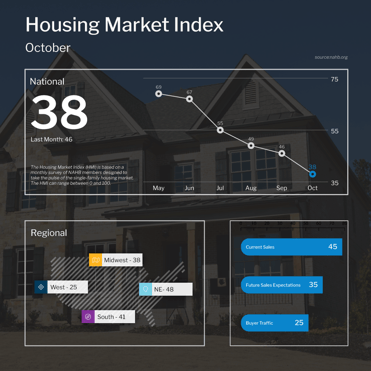
The National Association of Home Builders (NAHB) Housing Market Index, which is a near real-time read on builder confidence, fell 8 points to 38 in October, half the level it was just six months ago. All components of the index moved lower, with current sales conditions falling nine points to 45, sales expectations for the next six months dropping eleven points to 35 and buyer traffic also declining six points to 25, its lowest level since 2012 (except for the beginning of the pandemic in the spring of 2020).
What’s the bottom line? Any reading above 50 on this index, which runs from 0 to 100, signals expansion while readings below 50 signal contraction. This month’s confidence reading is the lowest since August 2012 (again except for the start of the pandemic) and well into contraction territory, which makes sense given that higher interest rates have led to weakening demand among buyers.
Jobless Claims Remain Volatile
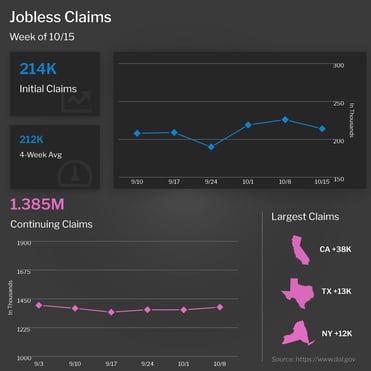
The number of people filing for unemployment benefits for the first time fell by 12,000 in the latest week, as 214,000 Initial Jobless Claims were reported. This decline followed increases of 29,000 and 7,000 in the previous two weeks’ filings. Continuing Claims, which measure people who continue to receive benefits after their initial claim is filed, rose 21,000 to 1.385 million.
What’s the bottom line? While this report can be the “canary in the coal mine” to show that the job market is starting to soften, the volatility of up and down continues and we’re still waiting for that recession-indicating sustained uptick in filings for unemployment.
More Economic Slowdown Signals
A number of major manufacturing indices, including those for the New York and Philadelphia regions, have all reported negative numbers far worse than expectations. In New York, October’s Empire State Index was more than twice as bad as anticipated, marking the third straight month below zero, while the Philadelphia Fed Index saw a second straight month in negative territory.
This data follows recent headlines out of the Financial Times and Wall Street Journal, which included, “Global Economic Warning Lights are Flashing Red,” “Risks of a Deeper Global Slump Escalate,” and “Economists Now Expect a Recession, Job Losses by Next Year.”
The International Monetary Fund also cut its global growth outlook for 2023, warning that recession risks are rising and the “worst is yet to come” for the global economy. The Fed’s latest Beige Book, which is a summary of commentary on current economic conditions, also featured the word recession a record high thirteen times.