
The Fed held its benchmark Fed Funds Rate steady, though there are signs that a higher for longer approach is ahead. Plus, elevated mortgage rates and tight inventory remain key factors impacting the housing market. Read on for last week’s stories:
- Will the Fed Keep Rates Higher for Longer?
- Inventory of Existing Homes Needs to “Double”
- Housing Starts Plunge to 2-year Lows
- Higher Rates Dampen Home Builder Sentiment
- Is a Rise in Unemployment Claims Ahead?
Will the Fed Keep Rates Higher for Longer?
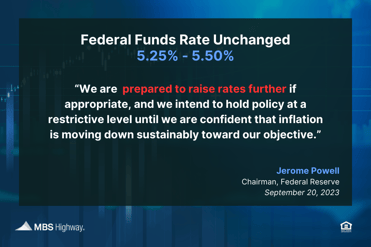
After eleven rate hikes since March of last year, the Fed left their benchmark Federal Funds Rate unchanged at a range of 5.25% to 5.5% at their meeting last Wednesday. The Fed Funds Rate is the interest rate for overnight borrowing for banks and it is not the same as mortgage rates. When the Fed hikes the Fed Funds Rate, they are trying to slow the economy and curb inflation.
What’s the bottom line? Despite holding the Fed Funds Rate steady last week, there were signs that the Fed may keep rates higher for longer. Projections in the Fed’s dot plot show one more hike is ahead this year. Plus, there are indications that we’ll only see two rate cuts in 2024, down from four previously.
Fed Chair Jerome Powell noted that the Fed remains “strongly committed to returning inflation to our 2 percent objective.” The Fed will be assessing incoming data ahead of their next meeting and rate decision on November 1, especially inflation and labor market figures. Yet, with recent job growth numbers being revised lower in subsequent reports (for example, June’s originally reported number of 209,000 new jobs has been cut in half to just 105,000 jobs), this data may not provide the most accurate picture.
The Fed expects stronger economic growth, as they revised their 2023 GDP forecast upward to 2.1% (more than double their June estimate of 1%). But this is in sharp contrast to the latest Leading Economic Indicators (LEI) from the Conference Board, which was down 0.4% last month, marking the seventeenth straight month of declines. This indicator (along with yield curve inversions, near record high credit card debt, and the lag effect of the Fed’s rate hikes) shows why a recession may not be off the table just yet.
While a recession is not a great thing for the economy, one positive aspect is that periods of recession are always coupled with lower interest rates.
Inventory of Existing Homes Needs to “Double”
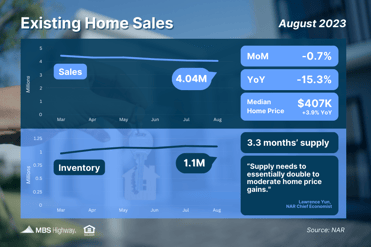
Existing Home Sales fell 0.7% from July to August to a 4.04-million-unit annualized pace, per the National Association of REALTORS® (NAR). Sales were also 15.3% lower than they were in August of last year. This report measures closings on existing homes, which represent a large portion of the market, making it a critical gauge for taking the pulse of the housing sector.
What’s the bottom line? Record low inventory and elevated mortgage rates remain key constraints on home sales. There were 1.1 million homes available for sale at the end of August, down from 1.28 million a year earlier and nearly half the levels seen in 2019. Plus, inventory is even tighter than that figure implies, as many homes counted in existing inventory are under contract and not truly available for purchase. In fact, there were only 669,000 “active listings” at the end of last month.
Yet, homes continue to sell quickly (averaging just 20 days on the market) and NAR’s Chief Economist Lawrence Yun noted that “home prices continue to march higher despite lower home sales.” He added that “supply needs to essentially double to moderate home price gains."
Housing Starts Plunge to 2-year Lows
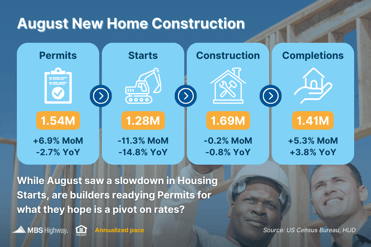
August brought a slowdown in home construction as Housing Starts, which measure the start of construction on homes, fell 11.3% from July. While the bulk of the pullback came in multi-family units, starts for single-family homes also declined 4.3%. Building Permits, which are indicative of future supply, did rise 6.9% from July while permits for single-family homes reached their highest level in a year.
What’s the bottom line? Given the resurgence in rates last month, it’s possible that builders were readying permits for what they hope is a pivot on rates and the increased buyer traffic that should follow.
Regardless, supply is still well below current demand. When we look at the pace of completed homes that will be coming to market (around 1.4 million homes annualized) and subtract roughly 100,000 homes that need to be replaced every year due to aging, we’re well below demand as measured by household formations that are trending at 2 million. Even looking at future supply (Building Permits at 1.5 million annualized), we’re still lower than where we need to be.
This ongoing disparity between supply and demand is a key reason why home values continue to rise and why now provides great opportunities to take advantage of appreciation gains.
Higher Rates Dampen Home Builder Sentiment
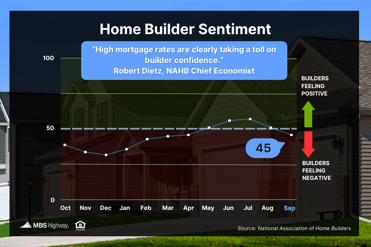
The National Association of Home Builders (NAHB) Housing Market Index fell five points to 45 in September, pushing builder sentiment below the key breakeven level of 50 for the first time since April. All three components of the index declined, with current and future sales expectations down six points to 51 and 49 respectively, and buyer traffic falling five points to 30.
What’s the bottom line? Rising mortgage rates, a lack of workers and buildable lots, and ongoing shortages of distribution transformers (which are crucial for converting voltage in transformer lines to appropriate household levels) were key reasons cited for declining confidence among builders. But there was a positive takeaway for potential buyers – 32% of builders reported cutting prices, the largest share since last December.
Is a Rise in Unemployment Claims Ahead?
Initial Jobless Claims fell by 20,000 in the latest week, reaching an eight-month low, with 201,000 people filing for unemployment benefits for the first time. Continuing Claims also declined by 21,000, with 1.662 million people still receiving benefits after filing their initial claim. This latter number has been trending lower since topping 1.861 million in early April, reflecting a mix of people finding new jobs and benefits expiring.
What’s the bottom line? While the tame level of Initial Jobless Claims suggests a strong labor market, these unemployment filings are usually the last data point to reflect a slowdown. Typically, we first see a decline in job postings, hirings, and a reduction in hours before layoffs occur and these first three trends have been seen in recent reports. It will be important to see if a sustained rise in Initial Jobless Claims follows in the coming months, especially with the Fed looking for clear signs that the labor market is softening as they consider further rate hikes this fall.